Introduction
When it comes to investing in mutual funds, most people focus solely on returns. But understanding mutual fund risk is equally important. Ignoring the risk factors can lead to unexpected losses, especially during volatile markets. Every mutual fund carries some level of risk, but the key is to know how to measure and manage that risk based on your financial goals and risk appetite.
Many investors unknowingly expose their portfolios to higher levels of risk by simply chasing past performance. However, relying only on returns without understanding the underlying volatility and risk factors can lead to poor investment outcomes. This is why it’s crucial to assess the risk level of each mutual fund you’re considering before making an investment.
In this article, we’ll walk you through seven detailed and effective ways to measure risk in mutual funds, with practical insights and examples, so you can make smarter, safer, and well-informed investment decisions.
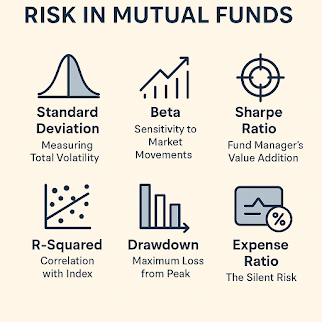
1. Standard Deviation – A Key Mutual Fund Risk Metric
Standard deviation is a statistical measure that tells you how much the fund’s returns deviate from its average over a period. It helps investors understand the total volatility of the fund. Funds with higher standard deviation tend to show wider fluctuations in returns, making them more unpredictable and potentially riskier.
For example, if a fund has an average return of 10% and a standard deviation of 5%, the returns typically vary between 5% and 15%. A higher standard deviation means the fund’s returns are more spread out, indicating more unpredictability and therefore more risk. Conversely, a lower standard deviation suggests a more stable investment with consistent returns.
👉 Tip: Compare the standard deviation of a fund with the category average. A significantly higher number could mean more risk than peers. Also consider the market phase — a high standard deviation in a bull run might be less concerning than the same in a bear market.
2. Beta – Sensitivity to Market Movements
Beta measures a mutual fund’s sensitivity to movements in a benchmark index (such as the Nifty 50 or Sensex). It reflects how much a fund’s return is expected to change in response to a change in the market. This helps investors determine whether a fund will outperform or underperform during periods of market ups and downs.
- A beta of 1 implies the fund moves in line with the market.
- A beta greater than 1 means the fund is more volatile than the market.
- A beta less than 1 implies the fund is less volatile.
For conservative investors or those approaching financial goals, a low beta fund might be more appropriate. Aggressive investors may prefer high-beta funds to take advantage of bull markets, while those looking for stability may find comfort in low-beta options.
⚖️ Example: If the market rises by 10% and a fund has a beta of 1.2, it may rise by 12%. However, during a 10% market decline, the fund may also fall by 12%.
🎯 Tip: Always use beta in conjunction with other metrics. A high beta with a high Sharpe ratio might still be a strong performer.
3. Sharpe Ratio – Evaluating Risk-Adjusted Returns in Mutual Funds
The Sharpe ratio measures the fund’s return after adjusting for the risk taken. It calculates the excess return (above the risk-free rate) per unit of total risk (standard deviation). It’s one of the most widely used tools to compare performance across funds with varying levels of risk.
The formula is:
(Fund Return – Risk-Free Rate) / Standard Deviation
- A higher Sharpe ratio is better, indicating the fund is generating better returns for the risk taken.
- A ratio above 1 is generally considered good.
This metric helps in comparing funds that may have similar returns but differing risk levels. It is especially useful when selecting between aggressive growth and balanced funds.
✅ Pro Tip: Always choose funds with a Sharpe ratio higher than the category average for better consistency. Also, compare this ratio across various time frames like 3-year, 5-year, and 10-year to evaluate consistency.
4. Alpha – Fund Manager’s Value Addition
Alpha is a measure of a fund’s performance relative to its benchmark index. It shows how much excess return the fund manager has delivered. Essentially, alpha measures the active return on an investment compared to a market index.
- Positive alpha = the fund has outperformed the benchmark.
- Negative alpha = the fund has underperformed.
A high and consistently positive alpha is a sign of an experienced and capable fund manager. It reflects the manager’s ability to make decisions that add value beyond what the market offers.
📈 Example: An alpha of 2 means the fund has outperformed its benchmark by 2% over the period considered. That extra return could be due to superior stock picking, timing, or allocation strategies.
🧠 Investor Note: Look for alpha across longer time frames (3 to 5 years). A one-year alpha could be due to short-term market conditions.
5. R-Squared – Correlation with Benchmark Index
R-squared (R²) indicates how closely a mutual fund’s performance is tied to a benchmark index. It is expressed as a percentage from 0 to 100 and is used alongside beta to understand the fund’s behavior.
- R² closer to 100% means the fund’s movements are almost entirely explained by movements in the index.
- Lower R² suggests that the fund manager is taking active positions that may not track the benchmark closely.
A high R² with a high beta suggests that the fund behaves like the index but with more volatility. A low R² means the fund may have unique movements, possibly due to active stock selection.
🎯 For index investors: Choose high R² funds for benchmark-tracking strategies.
💡 For alpha seekers: Consider funds with lower R² for active management. But ensure the manager has a good track record of delivering excess returns.
6. Drawdown – Maximum Loss from Peak
Drawdown measures the largest single drop from peak to trough in the value of a fund over a certain period. This metric helps gauge the potential downside during market corrections and is crucial for risk-conscious investors.
If a fund had a high drawdown in past bear markets, it could signal higher risk. Conservative investors should keep a close eye on this metric. Consistent lower drawdowns over time often indicate better downside protection and superior risk management.
📉 Investor Insight: A fund with a maximum drawdown of 10% is safer than one with a drawdown of 25%, assuming returns are similar.
📊 Tip: Review drawdown data during major market corrections like 2008 or 2020 to see how funds behave in stress scenarios.
7. Expense Ratio – The Silent Risk That Affects Returns
While not a direct measure of market risk, the expense ratio is a hidden cost that can significantly affect your mutual fund returns over time. It reflects the annual fee charged by the fund house for managing your investment. Higher expense ratios reduce the net returns you receive.
- A higher expense ratio reduces your overall return.
- Over long-term investments, even a 0.5% difference can lead to substantial value erosion.
🔍 Best Practice: Always compare the expense ratio among similar funds. Prefer direct plans over regular plans for lower costs.
💡 Note: An actively managed fund may justify a higher expense ratio if it consistently delivers alpha and superior returns.
Final Thoughts
Risk is an inseparable part of investing, but it doesn’t have to be scary. The key is to measure and understand mutual fund risk using the right metrics. By regularly reviewing indicators like standard deviation, beta, Sharpe ratio, alpha, drawdown, and expense ratio, you can choose funds that align better with your risk tolerance and long-term goals.
Instead of avoiding risk, focus on managing it intelligently. Use these metrics to build a diversified and risk-optimized portfolio. The most successful investors are not those who avoid risk entirely, but those who take calculated risks based on informed decisions.
Whether you’re a beginner or a seasoned investor, always remember: returns matter, but risk management matters more.
FAQ – Measuring Risk in Mutual Funds
Q: What is the best way to measure risk in mutual funds?
A: The best approach is to use a combination of standard deviation, beta, Sharpe ratio, and drawdown to get a complete picture of the fund’s risk.
Q: What does a high Sharpe ratio mean?
A: A high Sharpe ratio means the fund is delivering better risk-adjusted returns, which is desirable for most investors.
Q: How does beta help in understanding mutual fund risk?
A: Beta indicates how much the fund reacts to market changes. A beta above 1 means the fund is more volatile than the market.
Q: Is a higher expense ratio always bad?
A: Not always, but it should be justified by better returns or active management. Otherwise, lower expense funds are preferred.
Q: What is the role of alpha in fund selection?
A: Alpha helps identify the fund manager’s ability to generate returns above the benchmark. A consistently positive alpha is a good sign of skilled management.
Q: Why should I care about drawdown history?
A: Drawdown shows how much value a fund lost during tough times. It’s useful for assessing how resilient your investment might be during a crash.
Read more about: Investing, Mutual Funds, Personal Finance, SIP


1 Comment